


Content HRV Scanner:
Extended 24h analysis
Detailed assessment of the measurement quality
The basis of every HRV measurement is a registration of the ECG curve that is as artifact-free as possible. Motion artifacts, poor electrode contact, or other sources of interference such as electrical interference can result in a poor-quality ECG. This makes it more difficult to recognize heartbeats and errors in the calculation of the heart rate curve can occur.
In the HRV-Scanner, you have many tools available for post-processing measurements, such as graphic filters, plausibility checks and the option of manual post-processing at the QRS complex level.
About editing the measurement quality
In the first step of the evaluation, the best possible heart rate curve should be created by checking and processing the ECG.

To do this, the examiner must check whether an ECG of sufficient quality is available and whether all R peaks have been correctly identified. Manual post-processing at the level of the QRS complexes can be carried out via the ECG editor.

Artifacts and cardiac arrhythmias must be removed prior to evaluation. There are several filter options in the HRV scanner:
- High-pass low-pass plausibility graphic filter based on the Poincaré representation

Fig:. graphical filter based on a Poincaré diagram
In order to assess the validity of an HRV measurement, however, the measurement quality should always be examined in detail.
There are two diagrams for this in the HRV scanner:
Measurement quality broken down over time
Display of the measurement quality over the course of 24 hours. The individual error sources (gaps, arrhythmia, artefact ratio) are shown as error bars for every half hour, the ECG quality as a blue curve with an ECG quality for every half hour.

Measurement quality summed up for the day and night
The average error rates are shown separately for day and night. In general, the lower the error rates, the more plausible the HRV analysis.

About the measurement quality
The following sources of interference are recorded:
GapsIndicates the percentage of segments that contain gaps in the heart rate curve longer than 5 seconds. Gaps occur if, for example, an unfavorable ECG lead was selected and the R-waves are very small and are not reliably detected by the QRS analysis. However, gaps also arise when, for example, a severely shaky ECG (muscle and movement artifacts) leads to many false positive R-waves, which are then filtered out in the second step.
Arrhythmik
Indicates the percentage of segments with a noticeably high HRV. In particular, rapid changes in the heart rate, which are typical of arrhythmias or artefacts, are weighted. However, high arrhythmia values are not proof of a possible arrhythmia, since children and young athletic adults in particular sometimes have a very high HRV, which is physiological. In our experience, falsely high arrhythmia scores no longer occur in subjects older than 30 years with sinus rhythm. If in doubt, it is advisable to take a closer look at the ECG and the heart rate curve. Artifacts are often not sufficiently eliminated, or the heart rate curve has not yet been filtered.
Artifact RatioThe Artifact Ratio indicates the percentage of how many heartbeats were removed by filtering. The higher the ratio, the more heartbeats were detected, but classified by the user as not being associated with sinus rhythm and removed by filtering. The cause can usually be found on the ECG. In most cases, these are misdetected R-waves due to motion and muscle artifacts.
ECG qualityIncorrect or unrecognized heartbeats are usually caused by signal interference in the ECG. For this reason, the HRV scanner analyzes the ECG for typical disturbances such as mains hum or movement artefacts and calculates an ECG quality between 0-100% for half-hour periods. Eligible ECGs usually have an ECG quality of >80%. Severely declining ECG quality is a sign of signal interference, eg during sport or as a result of poor electrode contact. The lower the ECG quality and the higher the interference in a certain period of time, the more cautiously the HRV of this period should be interpreted.
The ECG quality is shown in the heart rate diagrams as a thin colored line according to the traffic light principle. As a result, indications of possible disturbances in the ECG signal are already obtained when inspecting the heart rate curve.

Abnormalities in the HRV
A good starting point for the HRV analysis is an overall view of whether it is a "normal" HRV measurement. "Normal" in this context means that most HRV parameters are in the normal range. For this purpose, the HRV scanner compares the respective result of 67 different HRV parameters with the corresponding age-corrected normal value table and uses this to calculate the respective rank value (ranking, percentile). Results beyond the 1% and 99% percentiles are rated as "remarkable".

70-year-old patient with vagal dysfunction and severe sleep apnea

47-year-old office worker, unremarkable measurement
Spiderweb charts with normative percentiles
Frequently used HRV parameters are shown in the spider webs, which as a rule should not be missing from any HRV analysis. The 95%, 50 % and 5% percentiles of the respective age groups are drawn.
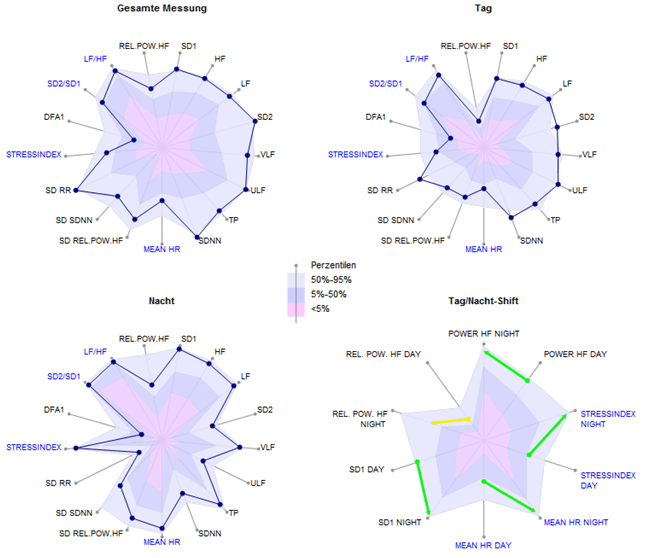
23-year-old competitive athlete. The 5%, 50% and 95% percentiles are plotted on each Spiderweb diagram.

74-year-old CHD patient with poor nocturnal recovery
About the Spiderweb Diagram
ScalingThe Spiderweb diagrams are always scaled the same, regardless of the subject, subject age and measurement period (day, night, total). The absolute scales are not labeled for reasons of better legibility. Due to the identical scaling, the diagrams can be compared with each other and between different subjects:
For example, the percentiles in the diagram above show that the “Rel. pow HF”, (relative power HF band) for most people is obviously significantly lower during the day than during the night. This corresponds to our intuitive expectation because daytime activities require a certain amount of sympathetic activity, which leads to a reduction in rel. Power HF leads.
Frequently used HRV parameters are shown in the spider webs, which should generally not be missing from any HRV analysis. "Blue" parameter names such as "Stress Index" or "Mean HR" indicate parameters for which low absolute values are medically more favorable than large absolute values. The scale is reversed for these “blue” parameters: the highest value on the scale is on the inside of the diagram, the lowest on the outside.
New in the HRV scanner are the parameters "SD RR", "SD SDNN" and "SD Rel. Pow. HF”. This is the standard deviation (SD) of the respective parameters. They are therefore measures of dispersion of the HRV and provide information on how much the individual parameters change in the respective time period (day/night/overall). They are therefore a measure of the change in stress. The greater the differences between loading and unloading and the more frequently the loading changes, the higher the standard deviations of the HRV.
"SD RR", also called SDANN: Standard deviation of the mean of the RR intervals in all five-minute bins of the entire recording.
"SD SDNN" Standard deviation of the SDNN of all five-minute increments of the 24-hour recording
"SD Rel. Pow. HF”: Standard deviation of the relative power HF band of all five-minute intervals of the 24-hour recording.
Note: The HRV scanner calculates the SD-X values in "Moving Windows" with a window width of 5 minutes and an increment of one minute
assessment of nocturnal rest
The Day/Night Shift spiderweb diagram shows the average daily value for a few selected parameters and the associated night value immediately next to it (counterclockwise). The corresponding percentiles are also plotted. An arrow colored according to the traffic light principle shows the change from day to night. If the absolute HRV value deteriorates, a red arrow is displayed. If the absolute HRV value and percentiles improve, a green arrow is displayed. If the absolute HRV value improves, but the ranking of the night value falls by more than 5%, the arrow is yellow (not optimal regeneration). The average relative improvement in HRV parameters is also calculated as a numerical value and is available as a recovery index.

Recovery index of a patient with a sleep disorder.
The recovery index expresses the average percentage improvement in important HRV parameters during the night compared to the day. The numerical value in brackets indicates how the calculated recovery index compares with a norm sample. On average, subjects in the normal value study achieved a recovery index of 31% with a standard deviation of 14%. In the example above, the recovery index is almost two standard deviations below the mean, so it is a significantly below-average recovery.
Heartbeats in 24 hours, heart rate and nocturnal decline
Numerous studies have shown that as the heart rate increases, the risk of mortality increases both in general (regardless of the cause of death) and in relation to common causes of death such as cardiovascular disease and cancer. How fast the heart beats or how often in 24 hours is one of the best documented risk parameters. In the HRV scanner, the heart rate is monitored over 24 hours in the form of the number of heartbeats per day. The separate observation of day and night and the drop in heart rate at night allows a more precise characterization of the person's heart rate behavior.

Example of a 30-year-old well-trained athlete with very good nocturnal recovery
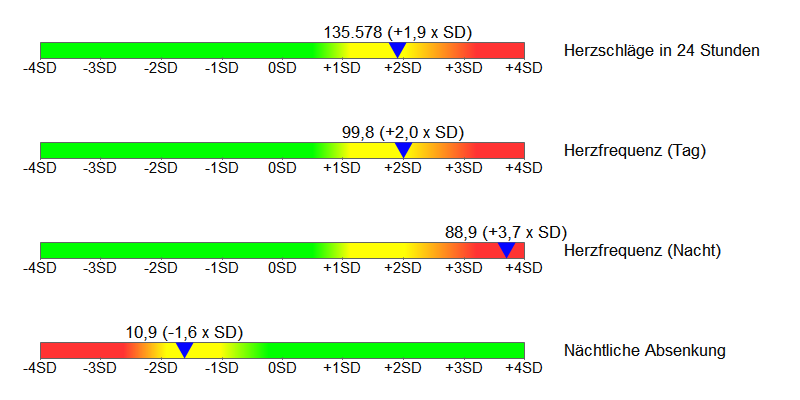
E.g. increased heart rate both during the day and at night with insufficient nocturnal recovery. 47-year-old CHD patient.
Specific performance indices for sympathetic and parasympathetic nervous system
To assess the vegetative balance, the HRV scanner calculates performance indices separately for day and night.
- PNS Index, (Parasympathetic Index): Based on parameters whose absolute value increases with increasing parasympathetic activity: Mean RR Distance, PNN50, Power HF, Rel. Power HF, SD1SNS Index, (Sympathetic Index): Based on Parameters whose absolute value increases with increasing sympathetic activity: mean heart rate, SD2/SD1 ratio, stress index.
To calculate the respective index, an age- and variance-corrected z-value is determined for each parameter and transferred to a standard normal distribution using z-transformation. The resulting index is the average of the Z-transformed values of the individual parameters.
A PNS index of 1xSD accordingly means that the underlying parasympathetic parameters are on average one standard deviation above the average of a normal value group of the same age.

VNS scores of a competitive athlete

VNS scores of a CHD patient
Fluctuation Index: The variation in variability
In addition to the absolute level of the HRV as a measure of the functional status of the autonomic nervous system, the observation of changes in the HRV over 24 hours also provides valuable information about possible stress or overload.
For this purpose, a fluctuation index is calculated separately for day and night. To do this, the measurement is broken down into 5-minute segments, for each of which a series of HRV parameters are calculated. For each HRV parameter, its standard deviation is calculated as a measure of dispersion and converted into a standard normal distribution using norm value tables. For example, if the associated fluctuation value for the SDNN has the value 0, this means that the fluctuations in the SDNN correspond exactly to the mean fluctuation of the norm population of the same age. A value of 1SD corresponds to a variation in SDNN that is one standard deviation above the mean of the age cohort

Example: 46-year-old office worker with normal HRV fluctuation (stress alternation) day and night

Example: competitive athlete, training day. Strong alternation of loading and unloading during the day, normal HRV fluctuation at night
„Functional HRV Age“ und „Premature Aging (PMA)“
The functional HRV age and the PMA value are calculated in the HRV scanner for 52 HRV parameters that have in common that they are highly correlated with age (r>0.5). The resulting functional HRV age is the median of the 52 individual values.
Age is a risk for cardiovascular disease, as is impaired neurovegetative regulation. The "functional HRV age" is a virtual age value that basically describes the state of the neurovegetative regulation in the sense of: "The neurovegetative regulation corresponds to that of a xx-year-old".

PMA diagram of a 68-year-old CAD patient. Very many parameters have a positive PMA value. The functional HRV age is 10 years older than the actual age
About the PMA
Age is one of the most important risk factors for cardiovascular diseases. As we get older, cardiovascular events like a heart attack are more likely to occur. For this reason, age is usually included as an important factor in the calculation of risk scores, see for example the Procam score. A reduced HRV can also indicate an increased cardiovascular risk.
It is interesting to look at HRV and age together: With increasing age, the neurovegetative regulatory ability and thus the HRV decreases, see figure:

For many HRV parameters, the age of the subjects is even the most important factor for the differences in HRV between different subjects (inter-individual variance). In this context, low HRV values below the regression line can be interpreted as premature aging (premature aging, PMA) of the neurovegetative control system. The extent of premature aging can be quantified by the functional HRV age (age resulting from the intersection of the HRV value with the 50% percentile of the normal value population.) The difference between the functional HRV age and the actual age is the PMA value and indicates how many years older the neurovegetative control system is than the actual age. Negative PMA values express that the neurovegetative control system is younger than it corresponds to the age.
The functional HRV age and the PMA value are calculated in the HRV scanner for 52 HRV parameters that have in common that they are highly correlated with age (r>0.5). The resulting functional HRV age is the median of the 52 individual values.
Functional HRV age as a risk parameter
We investigated whether functional HRV age can be used to distinguish cardiovascular disease from healthy individuals. For this purpose, the data of a healthy control group (n=140) were compared with those of a patient group with angiographically proven CHD (n=191). The effect size (Cohen's d) of the group difference was calculated for all calculated HRV parameters including “functional HRV age”. The greater the difference between two groups on a given parameter, the greater its effect size. To assess whether an effect size is large or small, see the table:

(https://en.wikipedia.org/wiki/Effect_size#Cohen’s_d)
Of all 311 HRV parameters examined, the “functional HRV age” was the parameter with the greatest effect size, with an effect size of 1.896, and thus the best ability to differentiate between CHD patients and healthy subjects. Common HRV parameters such as SDNN (d: 0.872), SD1 (d: 0.654) or Power HF (d: 0.881) showed significantly lower effect sizes.
The top position for the effect size for the "functional HRV age" was retained when the CHD patients were examined separately in the groups without beta blockers (d: 1.571) and with beta blockers (d: 1.972).
Conclusion: Age is a risk for cardiovascular diseases, as is restricted neurovegetative regulation. The "functional HRV age" is a virtual age value that basically describes the state of the neurovegetative regulation in the sense of: "The neurovegetative regulation corresponds to that of a xx-year-old".
The higher the "functional HRV age", the higher the likely higher the cardiovascular risk. Due to the heart rate correction when calculating the "functional HRV age", the latter is independent of the heart rate and can even be calculated for patients on beta-blocker therapy.
Sleep
Sleep is a highly active process, cycling through different levels of activation. Deep sleep phases alternate with light sleep phases and phases of high awake-like EEG activity with rapid eye movements (REM). During normal night sleep, the influence of the parasympathetic predominates with a simultaneously reduced sympathetic tone. In the REM phases, the sympathetic tone increases.
A good night's sleep is essential for maintaining good health. Insufficient sleep or poor sleep can lead to serious health problems if they persist. A well-known example is the increase in cardiovascular risk when sleep apnea occurs.

Sleep parameters of a healthy test person. A low OSA score lowers the likelihood of having OSA

Sleep parameters of a patient with polysomnographically confirmed OSA.
More info on sleep
The diagnosis of sleep disorders is complex and usually requires the registration of numerous different physiological parameters in the sleep laboratory (polysomnography). The HRV analysis cannot replace this, but the HRV analysis can sometimes provide valuable information about the presence of a sleep disorder: For example, characteristic changes occur in the case of frequent obstructive sleep apnea:
The HRV scanner looks for patterns in breathing, heart rate and HRV that are characteristic of sleep apnea. The strength and frequency of these patterns are quantified in the form of an "OSA score". The OSA score was developed using the SHHS study, which comprised several thousand polysomnographic data sets. (Quan SF, Howard BV, Iber C, Kiley JP, Nieto FJ, O'Connor GT, Rapoport DM, Redline S, Robbins J, Samet JM, Wahl PW. The Sleep Heart Health Study: design, rationale, and methods. Sleep . 1997 Dec;20(12):1077-85. PubMed PMID: 9493915.)
For validation, the algorithm was checked against the data sets of the freely available OSA database. (T Penzel, GB Moody, RG Mark, AL Goldberger, JH Peter. The Apnea-ECG Database. Computers in Cardiology 2000;27:255-258.) The correlation of the HRV-Scanner OSA score with the polysomnographically determined AHI (apnea hypopnea index) was 0.83. The sensitivity and specificity to detect moderate severity OSA (AHI>=15) was 95% and 96%, respectively. High OSA scores in the HRV scanner can therefore be interpreted as an indication of possible sleep apnea.
However, a high OSA score does not automatically mean that obstructive sleep apnea is definitely present. This also applies to all screening examinations, a positive test result does not necessarily mean that you are ill, even if it is often interpreted that way. The pre-test probability (prevalence) also plays a major role:
Breast cancer screening, for example, has a sensitivity of around 90% and a specificity of around 94%. With a prevalence of breast cancer of 0.8%, this results in a positive predictive value (posttest probability) of approx. 10% for breast cancer with a positive mammography finding. That means only 1 in 10 women with a positive mammogram actually have breast cancer. (Kerlikowske K, Grady D, Barclay J, Sickles EA, Ernster V. Likelihood ratios for modern screening mammography. Risk of breast cancer based on age and mammographic interpretation. JAMA. 1996 Jul 3;276(1):39-43.) (Depending on the underlying study, this value is sometimes slightly larger or smaller, but always of a similar magnitude).
The decisive variable of a diagnostic test is the likelihood ratio (LR) of the test, because the posttest probability can be calculated with the help of the LR and the prevalence, i.e. the probability that the disease is actually present if the test result is positive. For more information on the LR see also: https://en.wikipedia.org/wiki/Likelihood_ratios_in_diagnostic_testing
In short, the positive likelihood ratio (LRp) indicates how much more often a sick person gets a positive test than a healthy person. The negative likelihood ratio (LRn) indicates how much more often a sick person gets a negative test result than a healthy person.
Incidentally, the LR for mammography screening is about 14, ie positive mammography occurs 14 times more frequently in breast cancer patients than in women without breast cancer.
The HRV scanner calculates the associated likelihood ratios (LRs) for each OSA score. The probability (post-test probability, positive predictive value) of the presence of sleep apnea is also calculated using the prevalence table and the LRs (Punjabi NM., The epidemiology of adult obstructive sleep apnea, Proc Am Thorac Soc. 2008 Feb 15;5( 2):136-43.doi:10.1513/pats.200709-155MG.)
Color FFT analysis
Spectral analysis enables the frequency components in the heart rate curve to be determined. This allows conclusions to be drawn about the parasympathetic and sympathetic activity. Rapid changes in heart rate (> 0.15 Hz) reflect parasympathetic activity. In the color FFT plot, the activity in a specific frequency band at a specific time is color coded.
Respiration (breathing rate in Hz) is shown as a thicker red-brown curve. This makes it easier to assign activity bands that occur in the LF area to the parasympathetic nervous system if RSA is present.
The ratio LF/HF and Power LF/Power HF, the heart rate (mean HF, maximum and minimum heart rate) and the activity (measured by the movement sensors) are shown in the lower area.

HRV history
The colors shown in the HRV curve result from the percentage ranks of the age correlation of the short-term HRV measurement. For this purpose, the long-term measurement is divided into many short-term HRV measurements (5 minutes) and the percentage ranks in the age comparison are calculated for each section.
Alternatively, the underlying color can be calculated from the "mean value and standard deviation". It is also possible to display the curves without a color background.
Any parameters can be selected for displaying the HRV curve.
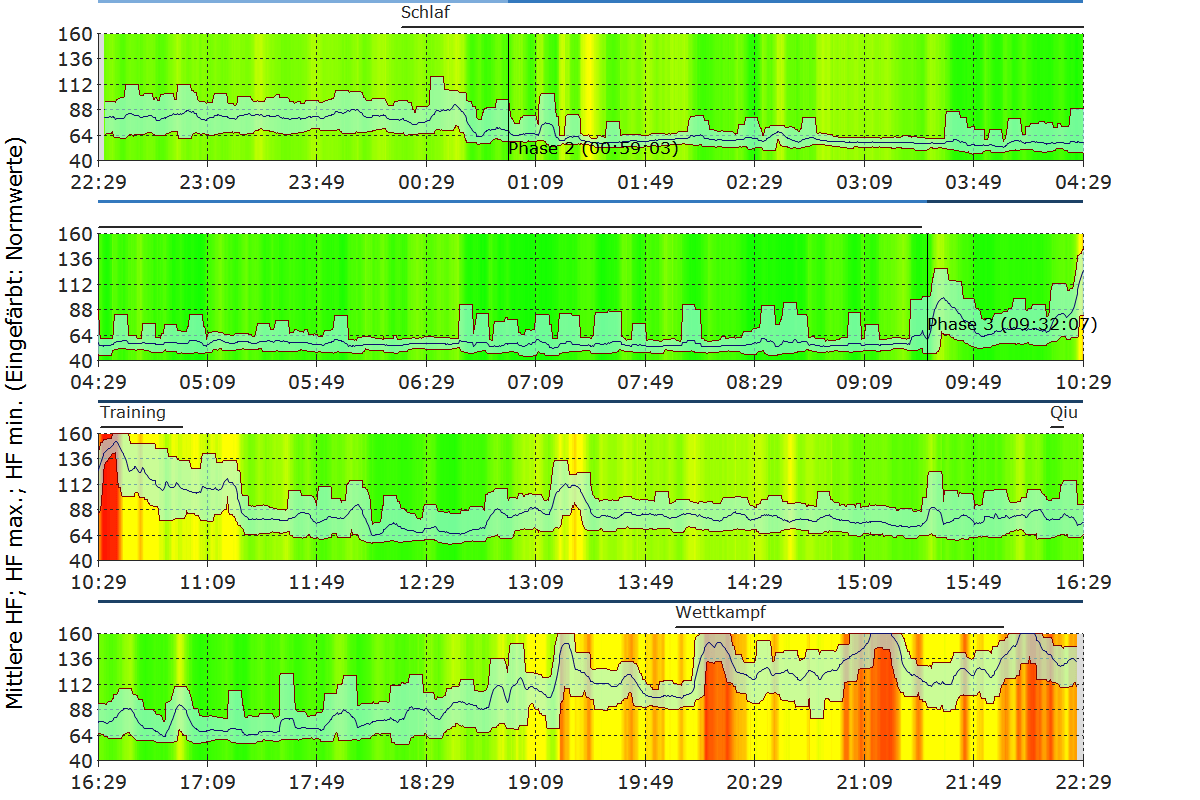
23-year-old professional athlete with very good nocturnal recovery, high nocturnal parasympathetic tone. Alternating stress during the day between resting phases and physical activity.